Incorporating analytics into Territory + Quota product at CaptivateIQ.
3 day sprint, 2 day hackathon
Senior Designer
Senior PM
4 Engineers
March - April 2025
Workshop facilitation
Design iteration & handoff
Design Lead,
Sprint Facilitator
Carving territories across multiple spreadsheets is an iterative, painful process for RevOps managers.
CaptivateIQ launched its second product, Territory & Quota, to expand from incentive compensation management (core product) into sales planning and management (second product). The MVP launched in August 2024, and I joined the team in January 2025 to lead design.
Getting high level with JTBD
In close collaboration with my PM, we conducted a discovery conversation with internal stakeholders and customers to establish a high-level JTBD, which we then broke down into phses, and those into user stories.
When managing my GTM strategy, I want to maximize the effectiveness of my GTM teams by creating a data-driven plan for achieving our business targets.
Supplemental emotional JTBD:
I want my sellers to be motivated by feeling that their territories are fair and that they're set up for success
I need my stakeholders to feel confident in the sales plan.
Phases and User Stories
Based on customer and internal stakeholder interviews conducted during the sprint.

Prioritized user stories to guide ideation and sketching
Sketches fueled by coffee, prioritized user stories (below), from mapping, and competitive research conducted by the whole team earlier in the sprint.
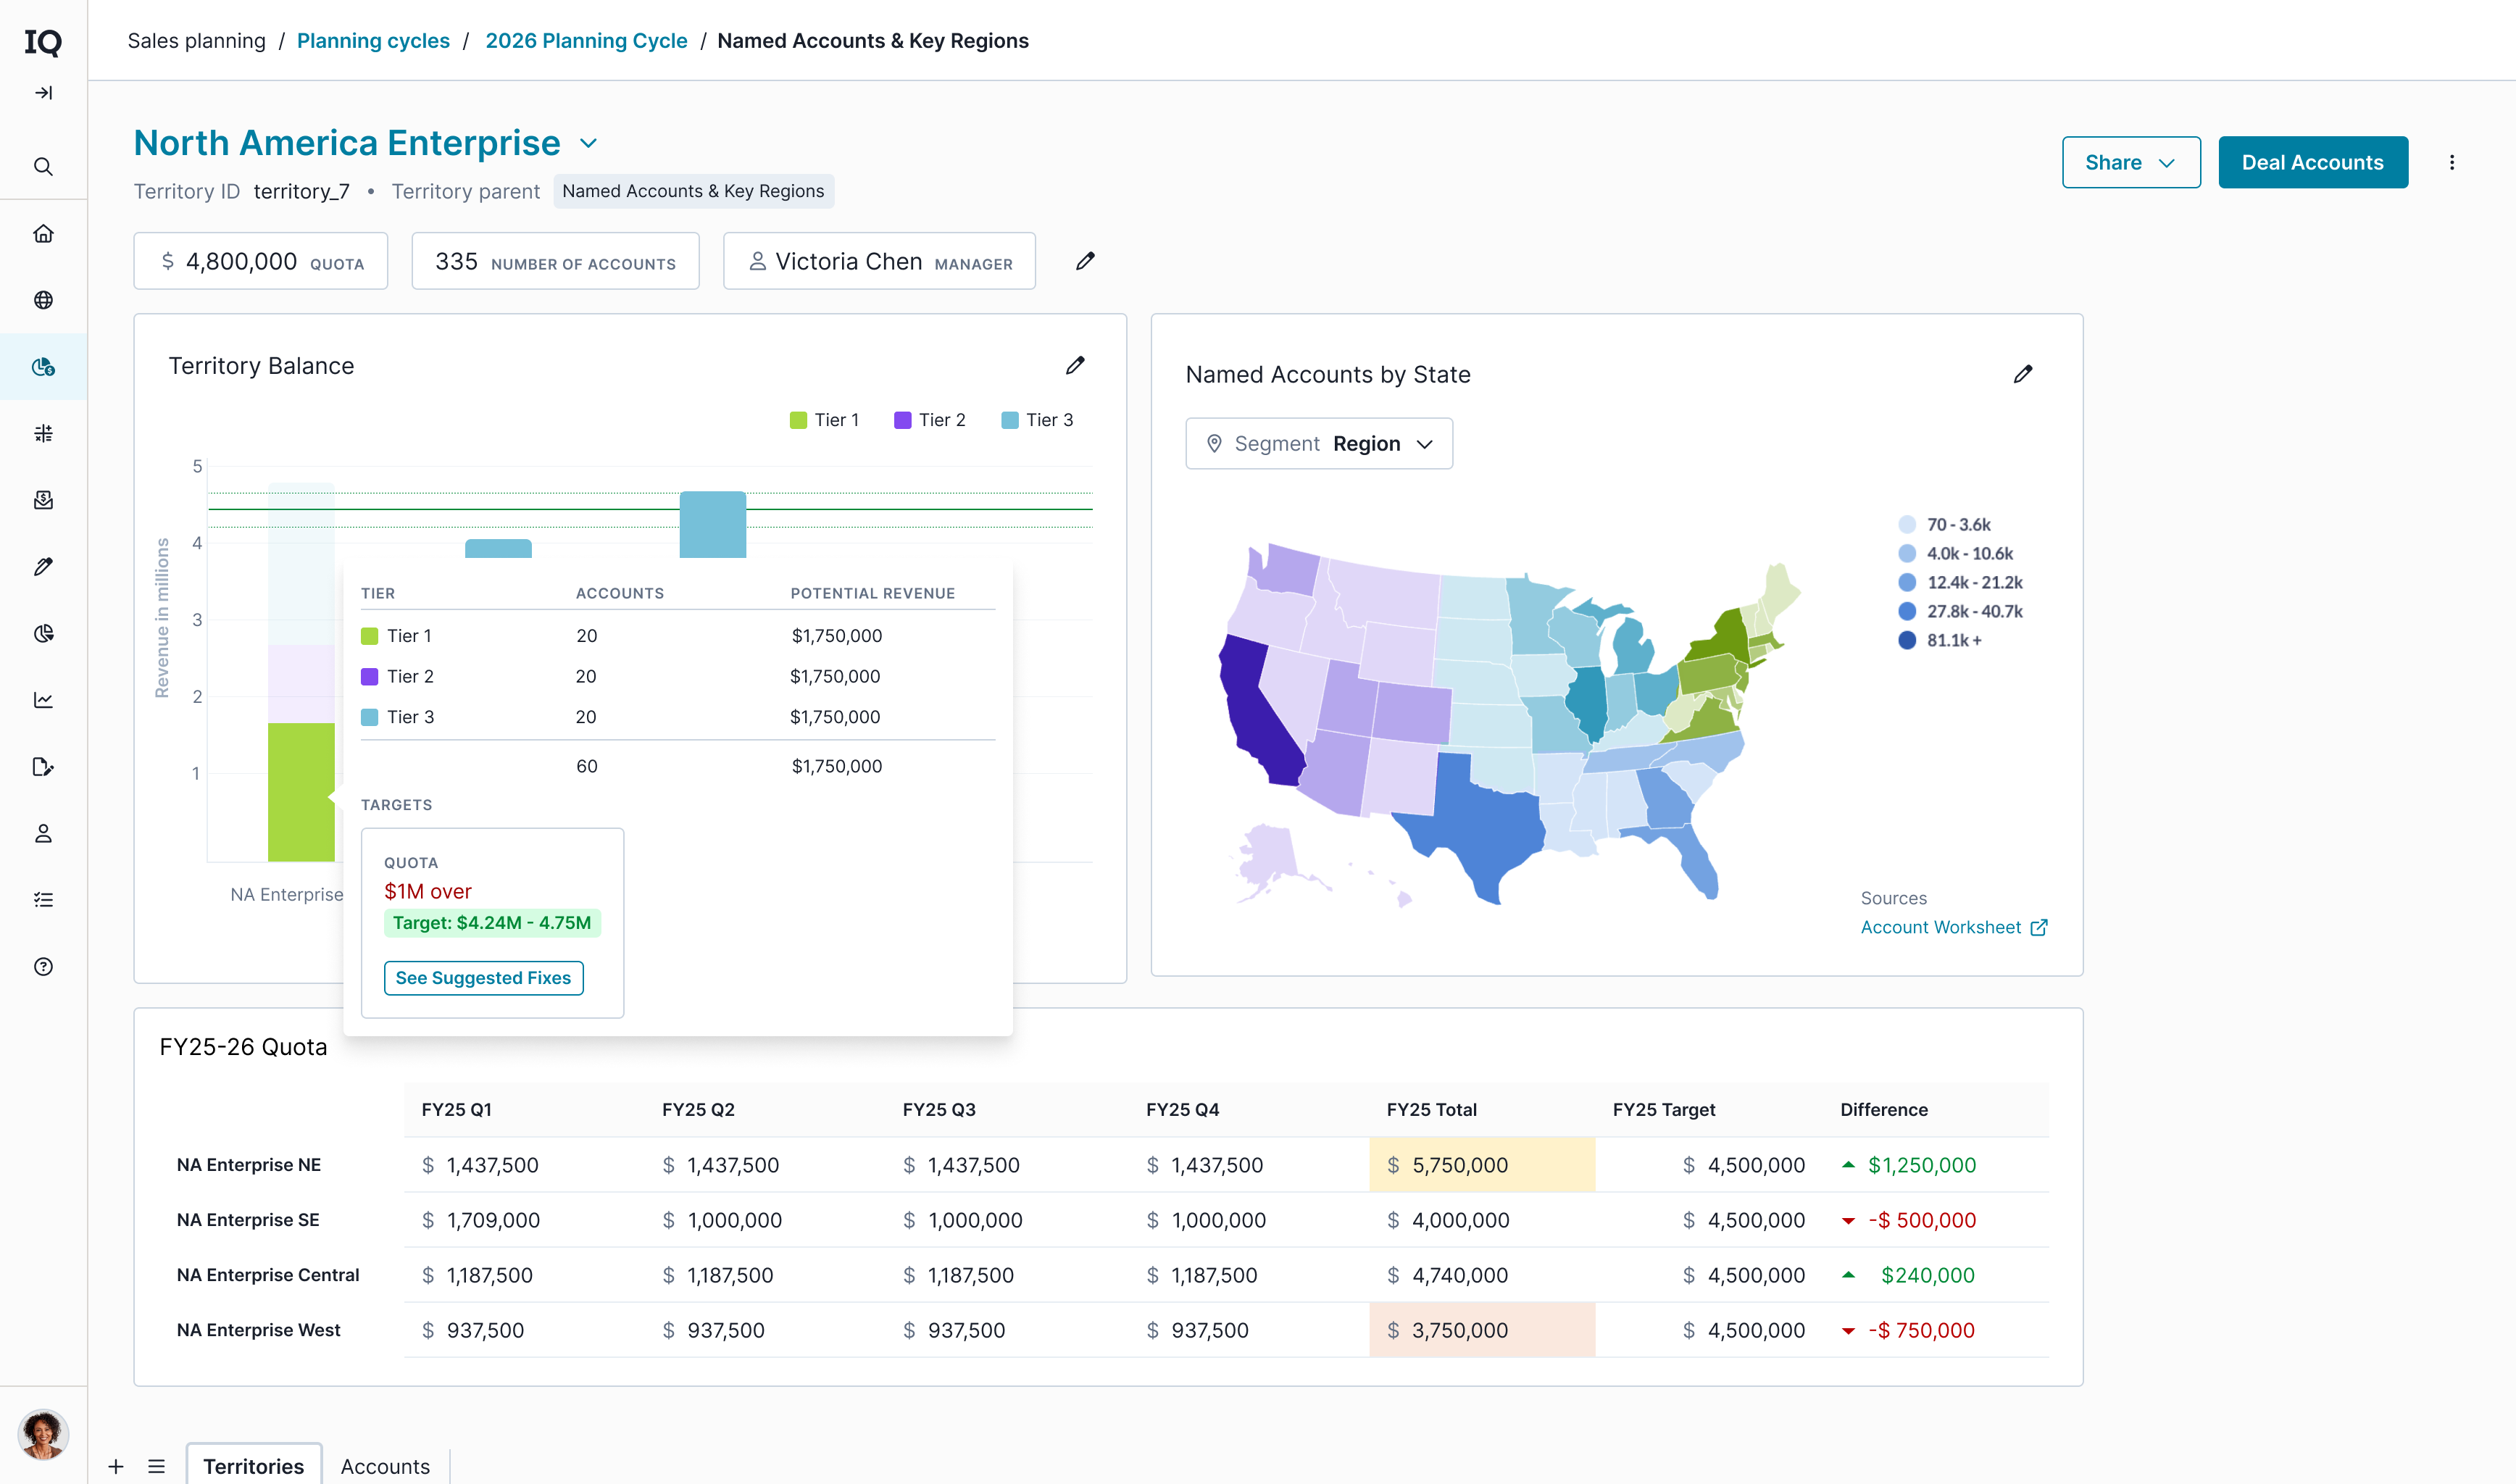
Visualize how the plan stacks up against key business metrics to decide if changes need to be made.
Maximize seller success by using data to focus on the customers that are the best fit for our business.
Visualize year-over-year performance to identify areas for improvement.
Easily analyze territories by using visuals to spot trends and outliers.
Team sketches - Crazy 8's


Prep for engineering hackathon
Upon making it through an abridged sprint, I created eng-ready designs to hand off throughout the 2-day hackathon. Because the engineers were involved in the sprint, we were all aligned and ready to build.
Plan of action:
- Create a live demo
- Share and test with internal stakeholders and customers
- Decide on chart library
- Prep for implementation
Design Iterations

Handoff to engineering
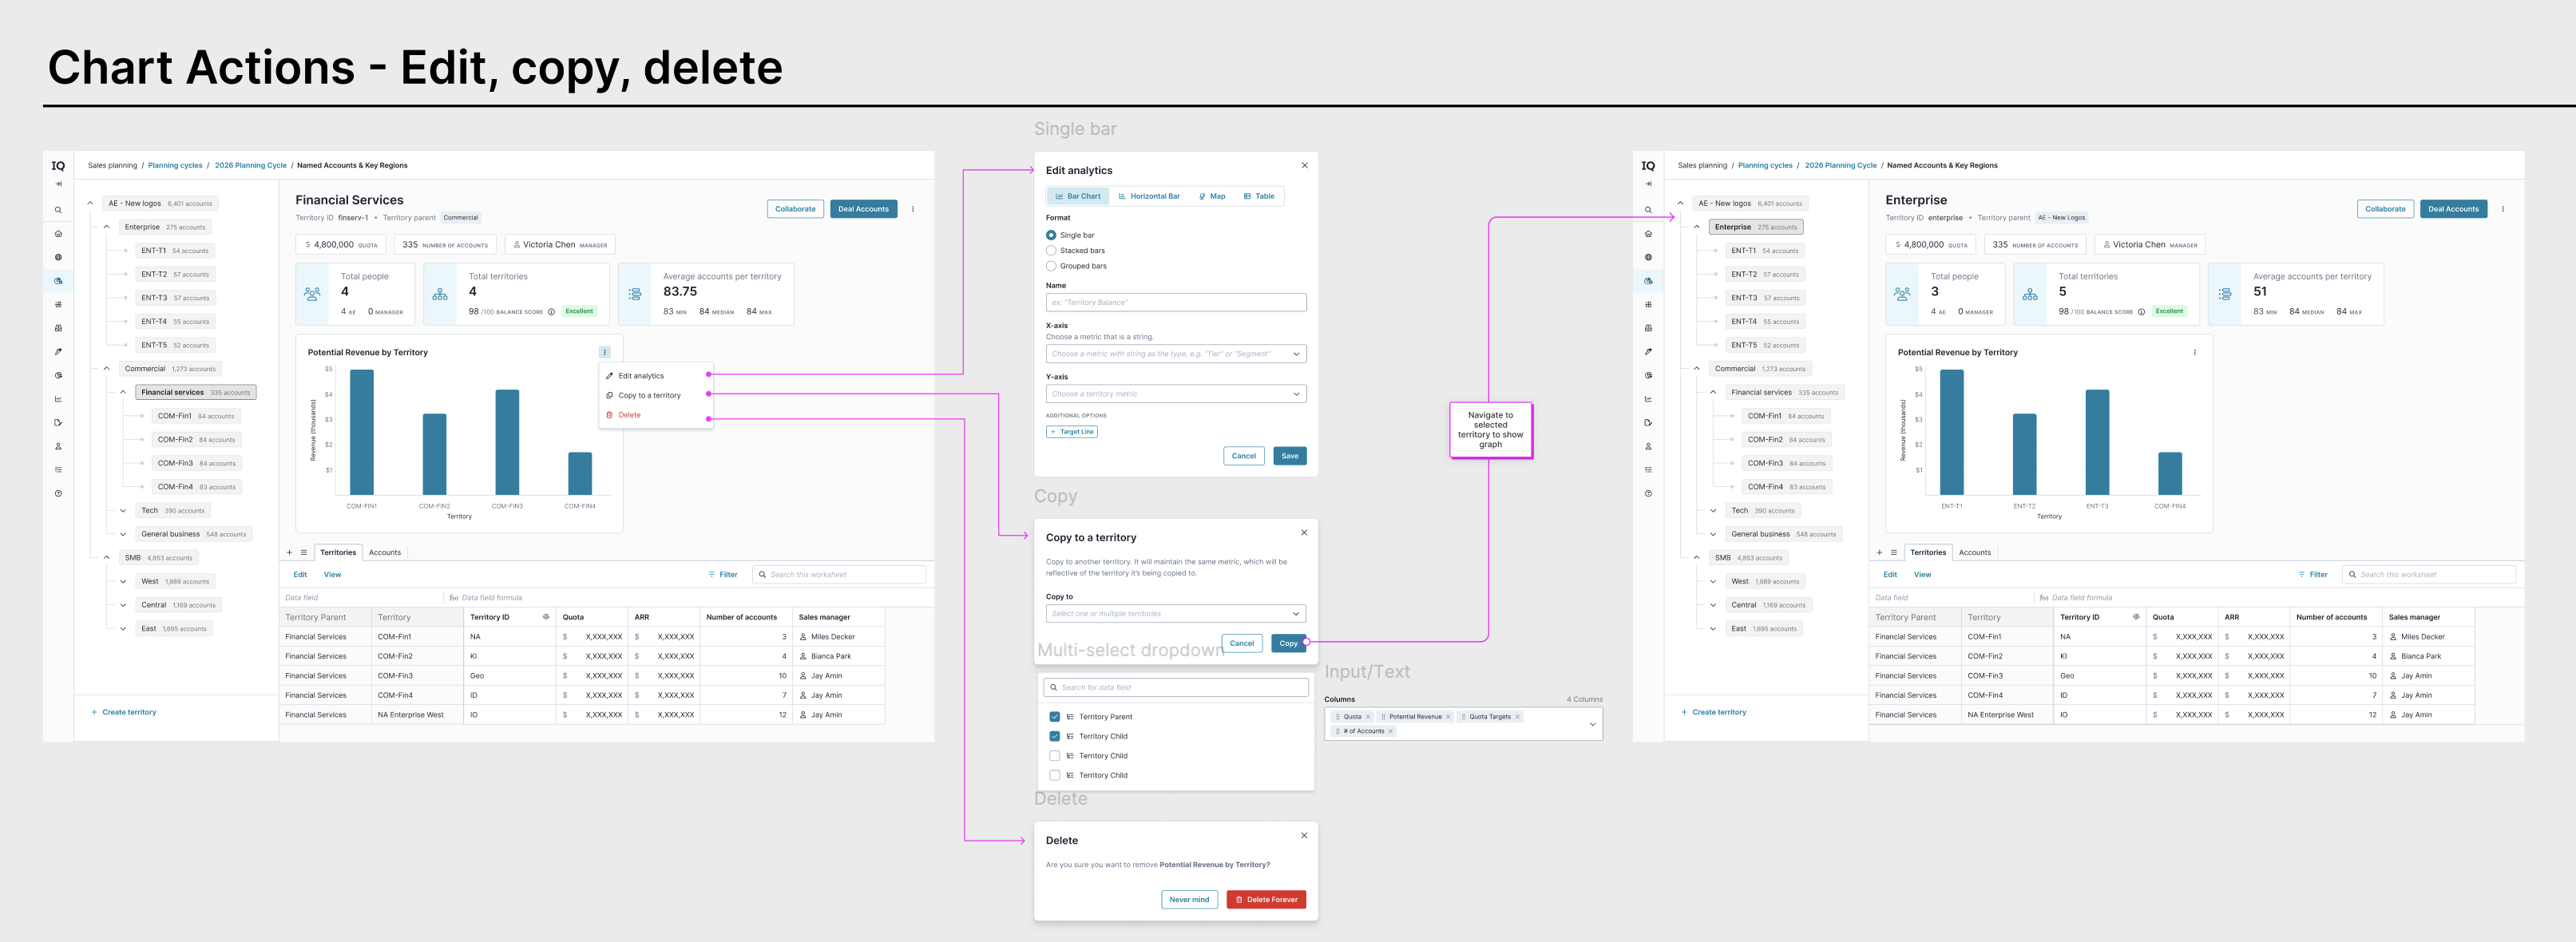
After validation from internal stakeholders, (Co-CEO, RevOp Director), I readied the file for engineering hand-off. Since we went through the sprint and hackathon, engineering was ready to go, while I worked on future designs and various states.

Next steps
We continued to iterate by:
- Adding new chart types
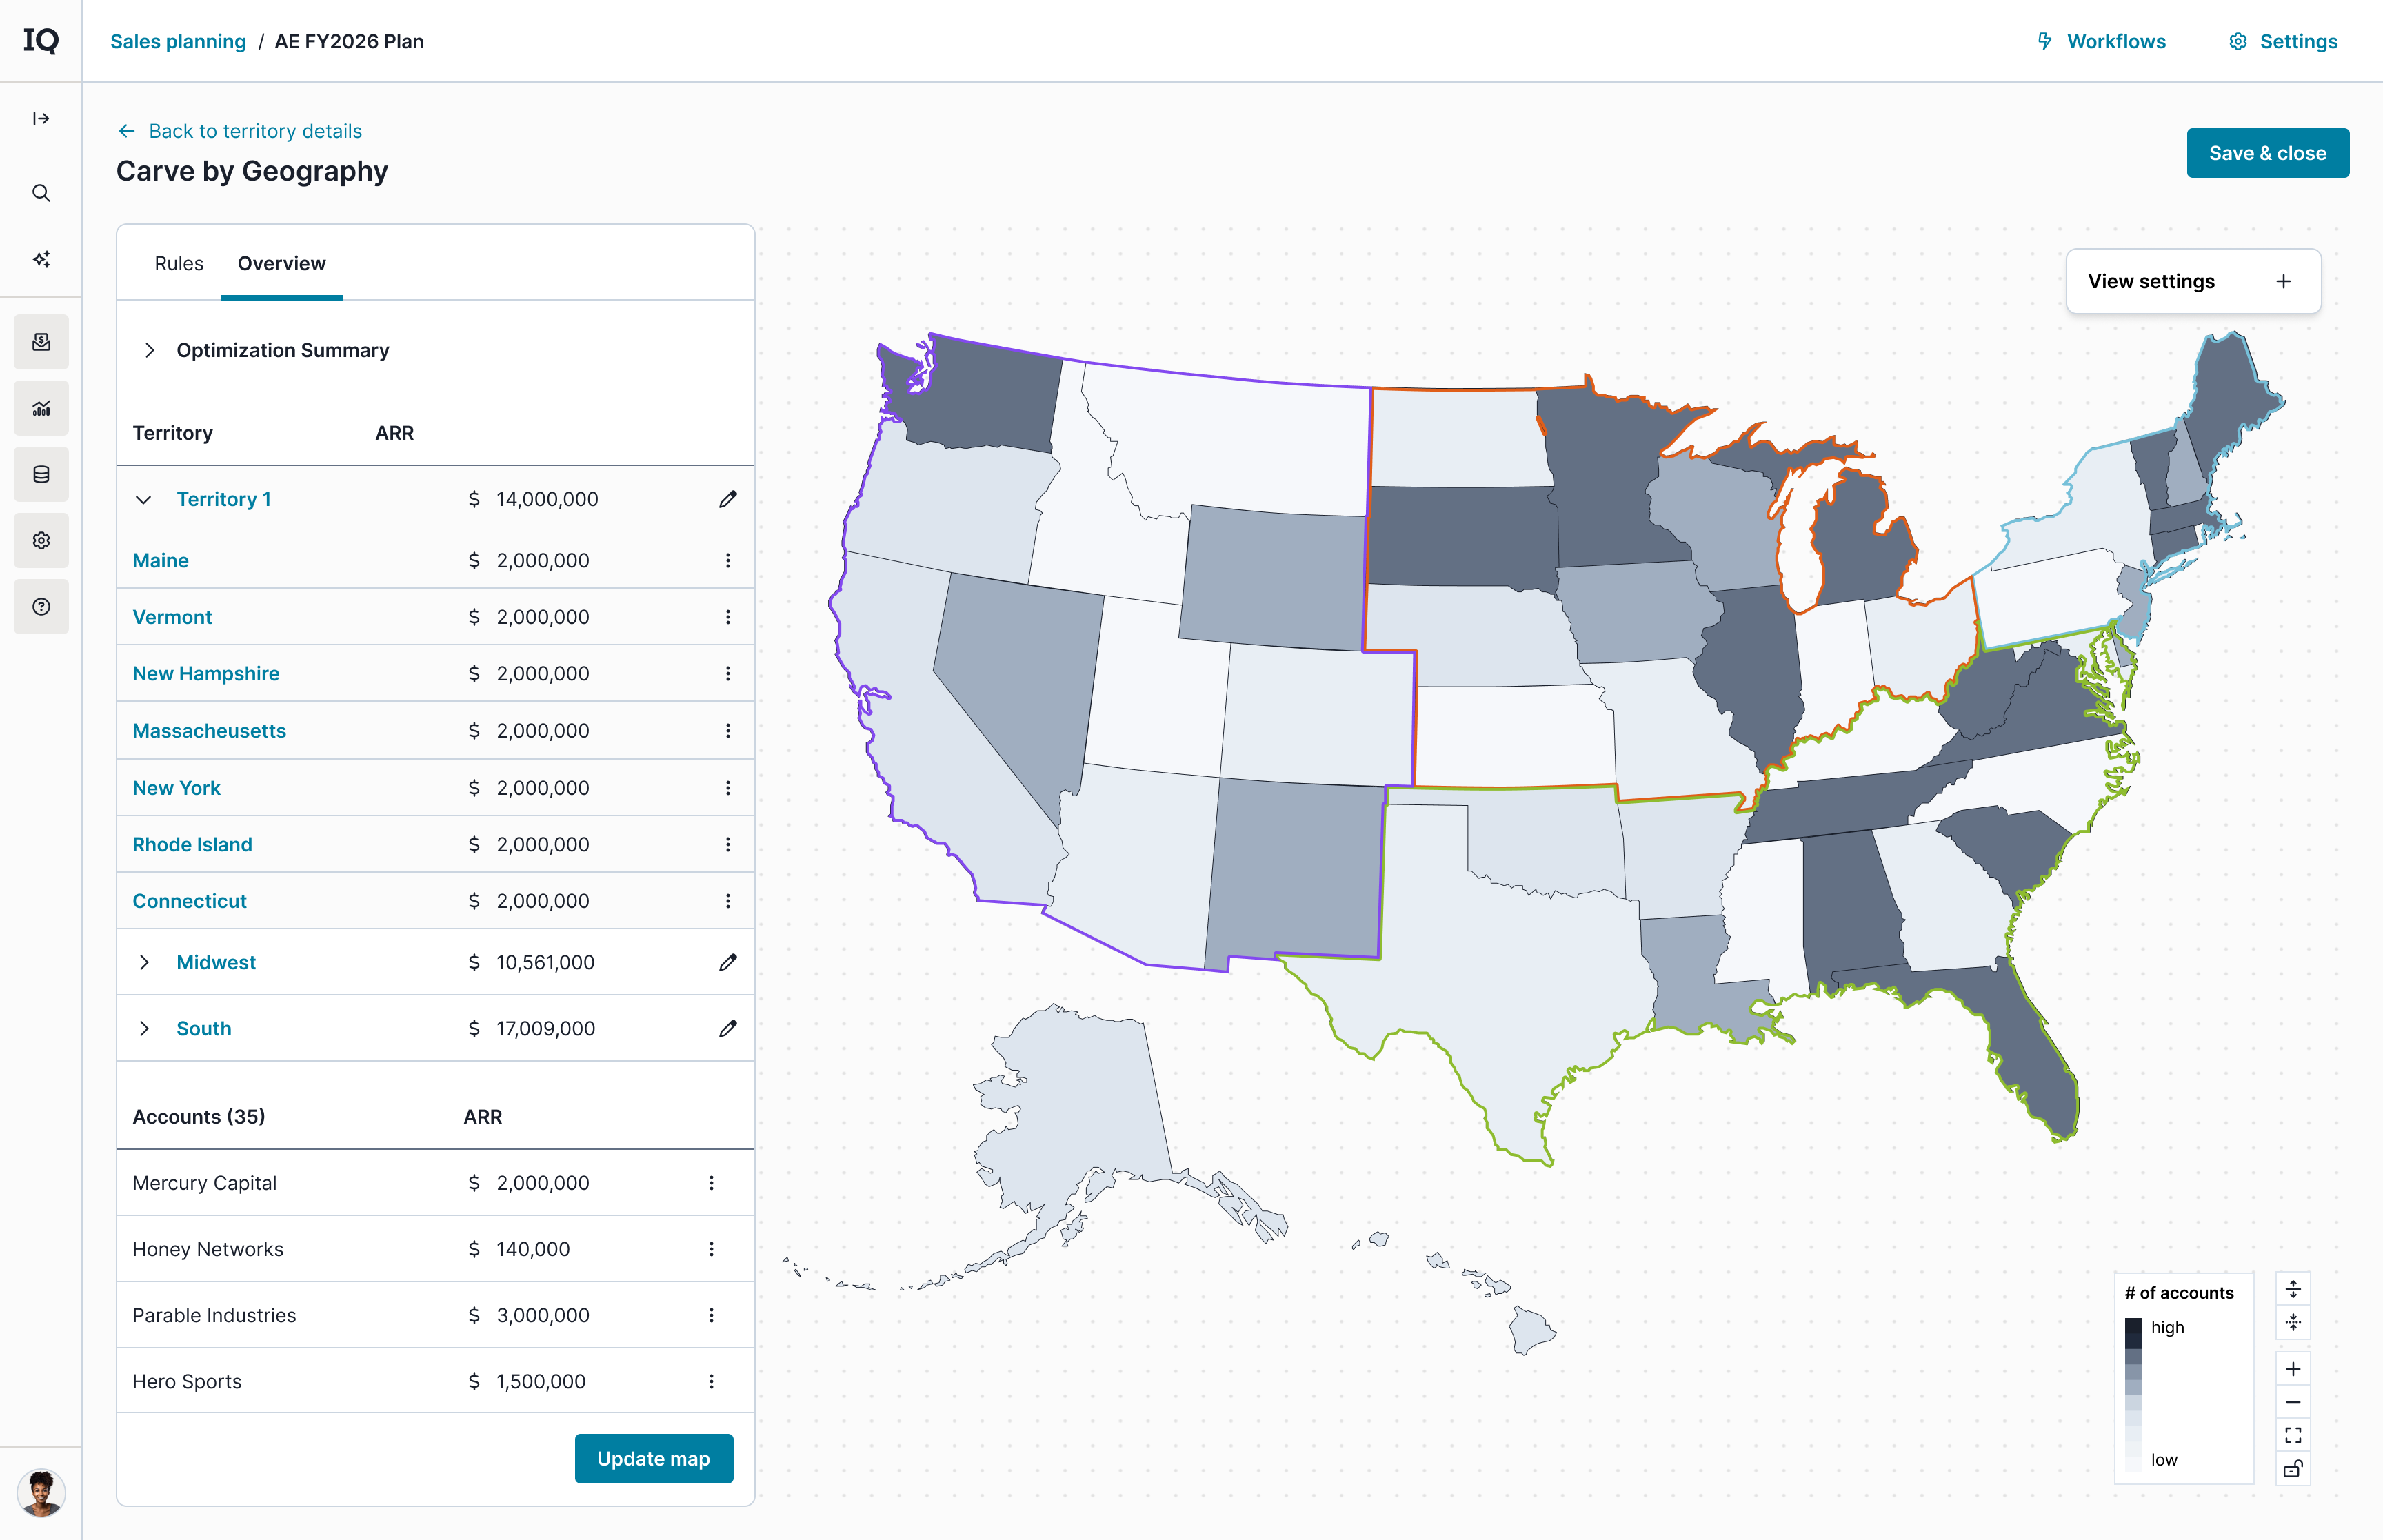
- Building out our own geo-carving tool
- Enhancing the data grid with customizable features like conditional formatting
- Planning with AI